Tanh vs Sigmoid
I've been exploring some very common activation functions and visualizing what effects these activation functions bring to the output at each layer.
Before we dive into some details, let me first introduce these activation functions.
I. Activation functions
1. Sigmoid
Sigmoid is one of the most common activation functions. The output of sigmoid can be interpreted as "probability" since it squashes the values to the range (0,1) so it is very intuitive to use sigmoid at the last layer of a network (before classifying). Sigmoid function takes on the form
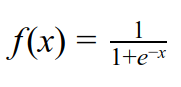 Sigmoid is a smooth function and is differentiable; however it suffers from gradient saturation issue when x is very large or very small (i.e. the gradient is very small). As depicted in the figure below, when f approaches either 0 or 1, the gradient becomes very small.

Another issue of the sigmoid function is that the output of it is not zero-centered. Therefore, in many cases tanh is preferred.
2. Tanh
Tanh is a scale version of sigmoid. In particular, tanh takes on the form
 with some algebra, we can see that tanh(x) = 2sigmoid(2x)-1, as follow
 Tanh squashes the values to the range (-1,1), and visually has the shape that is similar to sigmoid as depicted in the figure below.

Therefore, tanh also suffers from gradient saturation when output values are close to -1 or 1. However, the output of tanh is zero-centered, which makes tanh somewhat more preferable than sigmoid.
II. Interesting results
I wrote a tiny Colab Python3 piece of code of a simple feed forward network with 1000 layers. Input data x is drawn iid from a standard normal distribution and the weights are initialized using Xavier initialization (as to keep the output variance after the linear operation the same as the input). Different activation functions are applied and my aim is to visualize how these activation functions change the distribution of the output at each layer.
Firstly, 500 input data is drawn iid from a standard normal distribution as visualized below
 A simple feed forward is set up with the following flow at each layer: x -> h(x) = W*x -> g(x) = activation_function(x). The output of the activation function is the input to the next layer. Let's take a look at how the data distribution changes at every 100 layers.
1. Sigmoid
 Sigmoid's output takes on the form of a normal distribution. One other thing that is easily noticed is that the variance gets smaller. The following is the list of the variances of the histograms above.
Layer 0: 0.04740811910205372 Layer 100: 0.0177621073545928 Layer 200: 0.014916274682320409 Layer 300: 0.013728585466477766 Layer 400: 0.01589185067407601 Layer 500: 0.013874489981260308 Layer 600: 0.014751492889903765 Layer 700: 0.015756051722036445 Layer 800: 0.015498490295921197 Layer 900: 0.013429543934540059
The variance of the layers shrink to a pretty small value and seems to converge. Note that the mean of the data is still around 0.5.
2. Tanh

Same as sigmoid, tanh's output also takes on the form of a normal distribution apart from the first layer. The following is the variances of the layers.
Layer 0: 0.42336012787011296 Layer 100: 0.25311614239429847 Layer 200: 0.1805739412966219 Layer 300: 0.1349071950991805 Layer 400: 0.10435198013066826 Layer 500: 0.08629349671944968 Layer 600: 0.07710417872300651 Layer 700: 0.0684817189204742 Layer 800: 0.06124334084330391 Layer 900: 0.054039660669408435
The variance of tanh also seems to shrink down to a small value. Looking at the first 100 layers, the variance of tanh is around 16 times that of sigmoid. If we try to explain this using the Taylor series, it makes sense somewhat. Recall that the Taylor series evaluated at the point a is


Before we dive into some details, let me first introduce these activation functions.
I. Activation functions
1. Sigmoid
Sigmoid is one of the most common activation functions. The output of sigmoid can be interpreted as "probability" since it squashes the values to the range (0,1) so it is very intuitive to use sigmoid at the last layer of a network (before classifying). Sigmoid function takes on the form

Another issue of the sigmoid function is that the output of it is not zero-centered. Therefore, in many cases tanh is preferred.
2. Tanh
Tanh is a scale version of sigmoid. In particular, tanh takes on the form


Therefore, tanh also suffers from gradient saturation when output values are close to -1 or 1. However, the output of tanh is zero-centered, which makes tanh somewhat more preferable than sigmoid.
II. Interesting results
I wrote a tiny Colab Python3 piece of code of a simple feed forward network with 1000 layers. Input data x is drawn iid from a standard normal distribution and the weights are initialized using Xavier initialization (as to keep the output variance after the linear operation the same as the input). Different activation functions are applied and my aim is to visualize how these activation functions change the distribution of the output at each layer.
Firstly, 500 input data is drawn iid from a standard normal distribution as visualized below

1. Sigmoid

Layer 0: 0.04740811910205372 Layer 100: 0.0177621073545928 Layer 200: 0.014916274682320409 Layer 300: 0.013728585466477766 Layer 400: 0.01589185067407601 Layer 500: 0.013874489981260308 Layer 600: 0.014751492889903765 Layer 700: 0.015756051722036445 Layer 800: 0.015498490295921197 Layer 900: 0.013429543934540059
The variance of the layers shrink to a pretty small value and seems to converge. Note that the mean of the data is still around 0.5.
2. Tanh

Layer 0: 0.42336012787011296 Layer 100: 0.25311614239429847 Layer 200: 0.1805739412966219 Layer 300: 0.1349071950991805 Layer 400: 0.10435198013066826 Layer 500: 0.08629349671944968 Layer 600: 0.07710417872300651 Layer 700: 0.0684817189204742 Layer 800: 0.06124334084330391 Layer 900: 0.054039660669408435
The variance of tanh also seems to shrink down to a small value. Looking at the first 100 layers, the variance of tanh is around 16 times that of sigmoid. If we try to explain this using the Taylor series, it makes sense somewhat. Recall that the Taylor series evaluated at the point a is

Below is the first order Taylor series for sigmoid and tanh


We can see from the first order Taylor series above that at least for the first layers, the variance of tanh will be roughly 16 times the variance of sigmoid. Although this is just an estimation, since obviously by layer 100, tanh's variance is not roughly 1 as indicated by its first order Taylor series.
III. Conclusion
Sigmoid activation is intuitive for the last layer right before classifying since it squashes values to the range (0,1) which can be interpreted as "probability". However, tanh is sometimes more preferred for the "hidden" activation layers since it keeps the data zero-centered and helps the data from not getting denser with smaller variance.
Comments
Post a Comment